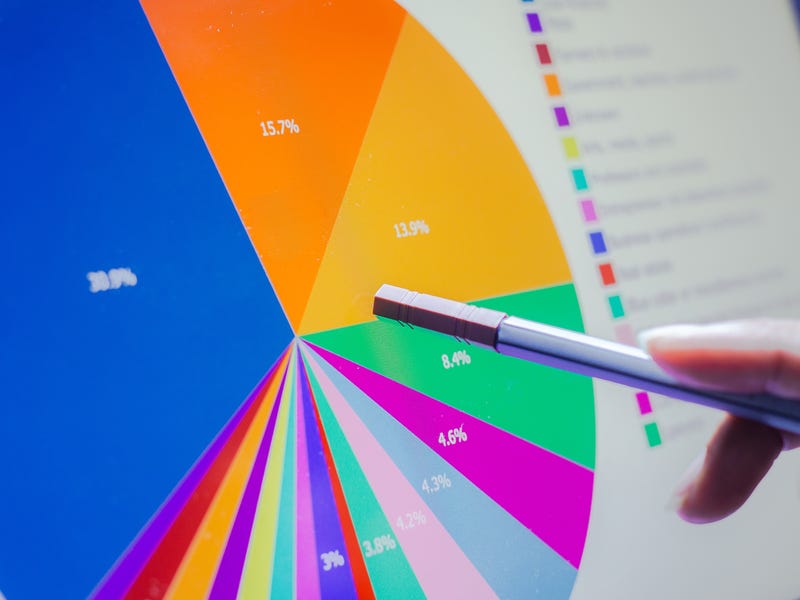
折れ線グラフは英語でline graphといいます。
会社のプレゼンで、研究の発表で、折れ線グラフを使われる方は多いのではないでしょうか?
折れ線グラフを使って推移や傾向を説明するときに、英語の表現で困ったことはありませんか?
増えた・減ったなど、シンプルな表現に逃げたり、単調に数字を読み上げてしまっていませんか?
今回はグラフの基本的な読み方から、数値の推移を分かりやすく語るための表現まで、折れ線グラフを用いての発表を表情豊かにするさまざまな英語表現をご紹介します。
この記事に沿って練習して、ぜひ、仕事場で練習の成果を披露してみてください。きっと、聞き手の反応に変化が起こるはずです。
1. 折れ線グラフの読み方:基礎編
ビールはお好きですか?ビールの消費量は季節によって上下しますよね。線グラフが完璧に読めるようになるために、今回は下の仮想のグラフを使って練習しましょう。

Y軸はConsumption(消費量)、X軸はMonth(月)です。単位は1万キロリットルとします。
1-1. 点を表現する
それではまずは発表しているグラフの意図によって異なる時制を正しく表現する練習をしましょう。グラフを発表する意図は、以下の3つのどれかが主になりますよね。
- 傾向の話 (現在形)
- 取れているデータの話 (過去形)
- 予測や見込みの話 (未来形)
それぞれ2通りの表現を紹介します。音声を真似て読んでみてください。
1-1-1. 傾向の話
Every year in April, beer consumption is approximately 500,000 kL.
毎年4月のビールの消費量はおよそ50万kLです。
Every year in April, there is approximately 500,000 kL of beer consumption.
毎年4月のビールの消費量はおよそ50万kLです。
1-1-2. 過去のデータの話
Last year in August, beer consumption was very high.
去年の4月はビールの消費量が非常に高かったです。
Last year in August, there was approximately 1,000,000 kL of beer consumption.
去年の4月のビールの消費量はおよそ100万kLでした。
1-1-3. 予測や見込みの話
This December, we expect beer consumption to be rather high.
今年の12月のビールの消費量はだいぶ高くなる見込みです。
This December, we expect to see approximately 700,000 kL of beer consumption.
今年の12月のビールの消費量はおよそ70万kLになる見込みです。
1-2. 線を表現する
増加、減少、横ばいを表す表現は数多くありますが、まずはもっともシンプルなものを2パターンずつ押さえておきましょう。
それでは増加、横ばいと減少の表現を3つの文脈で言い表す練習をしていきましょう。

1-2-1. 傾向の話
増加傾向
From May to July, beer consumption increases by approximately 600,000 kL.
5月から7月にかけて、ビールの消費量はおよそ60万kL増加します。
From May to July, beer consumption goes up by approximately 600,000 kL.
5月から7月にかけて、ビールの消費量はおよそ60万kL増加します。
横ばい傾向
From July to August, beer consumption usually remains flat.
7月から8月にかけて、ビールの消費量は通常横ばいになります。
Between July and August, beer consumption typically stays flat.
7月と8月の間、ビールの消費量は傾向として横ばいになります。
減少傾向
From August to September, beer consumption decreases by approximately 300,000 kL.
8月から9月にかけて、ビールの消費量はおよそ30万kL減少します。
From August to September, beer consumption goes down by approximately 300,000 kL.
8月から9月にかけて、ビールの消費量はおよそ30万kL減少します。
1-2-2. 過去のデータの話
増加した
From March to April, beer consumption increased by approximately 200,000 kL.
4月から5月にかけて、ビールの消費量はおよそ20万kL増加しました。
From March to April, beer consumption went up by approximately 200,000 kL.
4月から5月にかけて、ビールの消費量はおよそ20万kL増加しました。
横ばいだった
From July to August, beer consumption remained flat.
7月から8月にかけて、ビールの消費量は横ばいでした。
Between July and August, beer consumption stayed flat.
7月と8月の間、ビールの消費量は横ばいでした。
減少した
From September to November, beer consumption decreased by approximately 200,000 kL.
9月から11月にかけて、ビールの消費量はおよそ20万kL減少しました。
From September to November, beer consumption went down by approximately 200,000 kL.
9月から11月にかけて、ビールの消費量はおよそ20万kL減少しました。
1-2-3. 予測や見込みの話
増加見込み
From January to March next year, we expect beer consumption to increase by approximately 200,000 kL.
来年1月から3月にかけて、ビールの消費量はおよそ20万kL増加する見込みです。
From January to March next year, we expect beer consumption to go up by approximately 200,000 kL.
来年1月から3月にかけて、ビールの消費量はおよそ20万kL増加する見込みです。
横ばいの見込み
From July to August next year, we expect beer consumption to remain flat.
来年7月から8月にかけて、ビールの消費量は横ばいになる見込みです。
Between July and August next year, we expect beer consumption to stay flat.
来年7月と8月の間、ビールの消費量は横ばいになる見込みです。
減少見込み
From April to May, we expect beer consumption to decrease by approximately 100,000 kL.
4月から5月にかけて、ビールの消費量はおよそ10万kL減少する見込みです。
From April to May, we expect beer consumption to go down by approximately 100,000 kL.
4月から5月にかけて、ビールの消費量はおよそ10万kL減少する見込みです。
1-3. 角度を表現する
変化の大きさと変化の速さを言い表すための代表的な表現は、以下の通りです。
1-3-1. 変化の度合い
増加/過去/大幅
Last year, beer consumption increased significantly between May and July.
昨年、ビールの消費量は5月から7月の間に大きく増加しました。
減少/傾向/大幅
Beer consumption typically goes down substantially after August.
傾向としてビールの消費量は8月から大きく下がります。
増加/予測/若干
From March to April, we expect beer consumption to increase somewhat.
3月から4月にかけて、ビールの消費量は若干増加する見込みです。
減少/過去/わずかに
In May, beer consumption went down slightly.
5月はビールの消費量が微減しました。
増加/傾向/わずかに
From January to February, beer consumption tends to increase slightly.
1月から2月にかけて、ビールの消費量は微増する傾向にあります。
1-3-2. 変化の速度
増加/傾向/急激に
After May, beer consumption increases quickly until July.
5月から7月までビールの消費量は急激に増加します。
減少/過去/急激に
From August to September last year, beer consumption went down rapidly.
去年8月から9月にかけて、ビールの消費量は急激に減少しました。
増加/傾向/ゆるやかに
From January, beer consumption typically goes up slowly for a few months.
ビールの消費量は傾向として1月から数カ月間、ゆっくりと増加します。
減少/予測/ゆるやかに
After September, beer consumption is expected to decrease gradually.
9月からビールの消費量はゆっくりと減少する見込みです。
ここまでの文章を、音声と同じくらいスラスラ言えるようになったら再びビールの消費量のグラフに戻ってみましょう。1月から12月までの推移を以下の3つの文脈で発表できるか、試してみましょう。
- ビールの消費量を毎年の傾向として発表
- 昨年の消費量の推移として発表
- 来年の消費量の予測として発表
この3種類の発表が迷うことなくできれば、誰が聞いてもわかりやすいグラフ発表ができるということです。できた人は、応用編に進んでください。

2. 折れ線グラフの読み方:応用編
ここからは基本の表現一辺倒では物足りない!という方向けに、表現の引き出しを増やすための練習メニューになります。言葉巧みにグラフ発表できるようになりましょう!
2-1. 点を表現する
数値を述べる時、その数値の意味合いも同時に伝えられれば一石二鳥です。
In July, beer consumption is as high as 1,000,000 kL.
7月のビールの消費量は100万kLと、高いです。
In May last year, beer consumption was as low as 500,000 kL.
昨年5月のビールの消費量は50万kLと、低くなりました。
This December, we expect beer consumption to peak at approximately 700,000 kL.
12月には70万kLあたりまで達する見込みです。
Beer consumption typically hits bottom at approximately 500,000 kL in November.
ビールの消費量は通常11月に50万kLあたりで下げ止まります。
2-2. 線を表現する
基礎編で紹介したincrease, go downなどの数値の変化の表現はすべて動詞でした。ここではincrease, decreaseを名詞として使う場合の表現をお教えします。動詞の場合のイントネーションと名詞の場合のイントネーションは異なります。音声で違いを聴き比べてみましょう。
Increase (動詞) / increase (名詞) / decrease (動詞) / decrease (名詞)
増加/傾向
From May to July, there is an increase of approximately 600,000 kL in beer consumption.
5月から7月にかけて、ビールの消費量はおよそ60万kL増加します。
減少/傾向
From August to September, there was a decrease in beer consumption of approximately 300,000 kL.
8月から9月にかけて、ビールの消費量はおよそ30万kL減少します。
横ばい/過去
From July to August, there was no change in beer consumption.
7月から8月にかけて、ビールの消費量は横ばいでした。
増加/予測
From January to March next year, we expect an increase in beer consumption of approximately 200,000 kL.
来年1月から3月にかけて、ビールの消費量はおよそ20万kL増加する見込みです。
減少/予測
From April to May, we expect a decrease in beer consumption of approximately 100,000 kL.
4月から5月にかけて、ビールの消費量はおよそ10万kL減少する見込みです。
2-3. 角度を表現する
引き続き、変化を名詞で表現しながら、変化の度合いや速度の表現方法を練習しましょう。また、ここまでに紹介していない単語も混ぜていきます。
増加/過去/大幅
Last year, we observed a significant increase in beer consumption between May and July.
昨年、ビールの消費量は5月から7月の間に大きく増加しました。
減少/傾向/大幅
We typically see a substantial decline in beer consumption after August.
傾向としてビールの消費量は8月から大きく下がります。
増加/予測/若干
From March to April, we expect moderate growth in beer consumption.
3月から4月にかけて、ビールの消費量は若干増加する見込みです。
増加/傾向/急激に
After May, there is a rapid rise in beer consumption until July.
5月から7月までビールの消費量は急激に増加します。
減少/過去/急激に
From August to September last year, we saw a quick drop in beer consumption.
去年8月から9月にかけて、ビールの消費量は急激に減少しました。
3. 折れ線グラフを巧みに発表する例
それでは最後にこれまで紹介した表現を使って、ビールの消費量に関するグラフを1月から12月まで一気に発表する音声を、グラフを目で追いながら聴いてみましょう。聴き易くするために、最初に一度beer consumptionと言った後は、itやconsumptionに置き換えているところにも注目です。

OK, let me go over the beer consumption trends in Japan.
Consumption is low at the start of the year. It gradually increases until April where it peaks at approximately 500,000 kL. In May, consumption goes down slightly but we usually see rapid growth between May and July. In July, consumption is as high as 1,000,000 kL and it stays flat for another month. There is a significant decline between August and November, and it hits bottom in November at 500,000 kL. Between November and December, consumption increases somewhat and reaches approximately 700,000 kL.
音声のように色々な表現を織り交ぜれば、聴き易い発表になります。次回のグラフ発表で練習の成果を試してみてください!
無料体験レッスンお申込みフォーム
無料体験レッスンは、教室・オンラインをご用意。
一部のプログラムは、無料オンライン体験または受講相談のみとなる場合がございます。


